Mitrtown Office Tower is a Grade A office building, located in the CBD of Bangkok. This Intelligent office tower was designed under the concept of “Smart & Friendly”. Our team, bit.studio, took a role to give users creative and fresh daily content through various screens in the reception area, elevators’ hall and outdoor facade.
This project is one of a great combination of design development, which matches perfectly with user’s behavior, and technical challenges, which generates a real time visually and informationally graphics based on the design requirements.
To create an experience that matches our users, we have to know who they are, what are their shared interests which can be provided by the given screens, their attention, and their behavior or activities that can happen in the lobby.
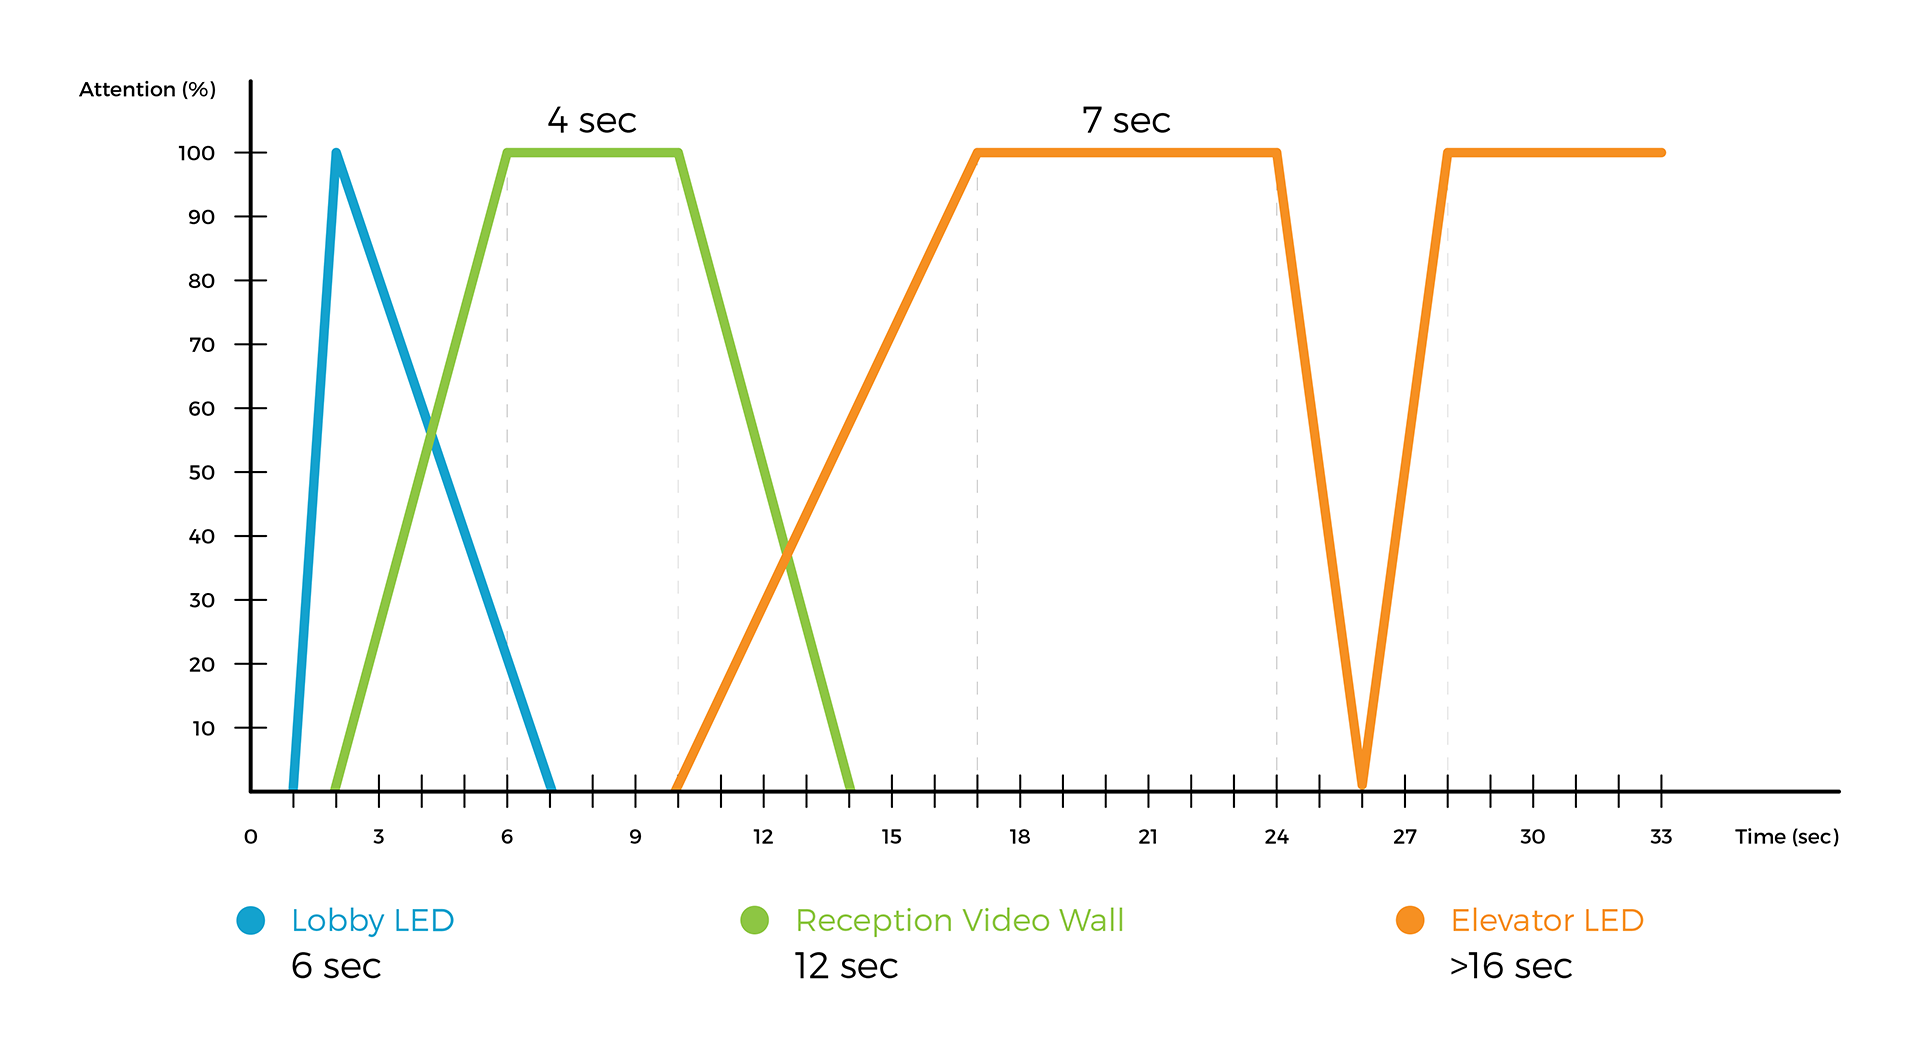
From our site survey and observation, we found that our target audience is office workers working in the building. Their attention corresponds to their walking path starting from the lobby LED, which catches their attention the most yet takes their time the least, to the reception video wall, and the elevator LED, which users will spend their time with it the most while they are waiting for the elevator. Time is also one of major factors that affect users’ interests which differ from each period of time during the day.
Other than our target audience, we also looked into people’s behavior with similar types of media, such as screens which are mostly seen in mass transit systems. From our observation, people tend to ignore public screens. Not that they intuitively ignore the screens but they develop a habit of ignoring commercials on the screen. With this perspective in our mind, we aimed to create a new user habit which makes users want to take a glance at the screens everyday, to make the most of all the screens in the lobby. To create such a habit, we chose to deliver users’ interests at the right time. The content should be expectable yet not boring in order to keep users’ attention with their interested information and pleasant ever-changing visuals.
Design Development
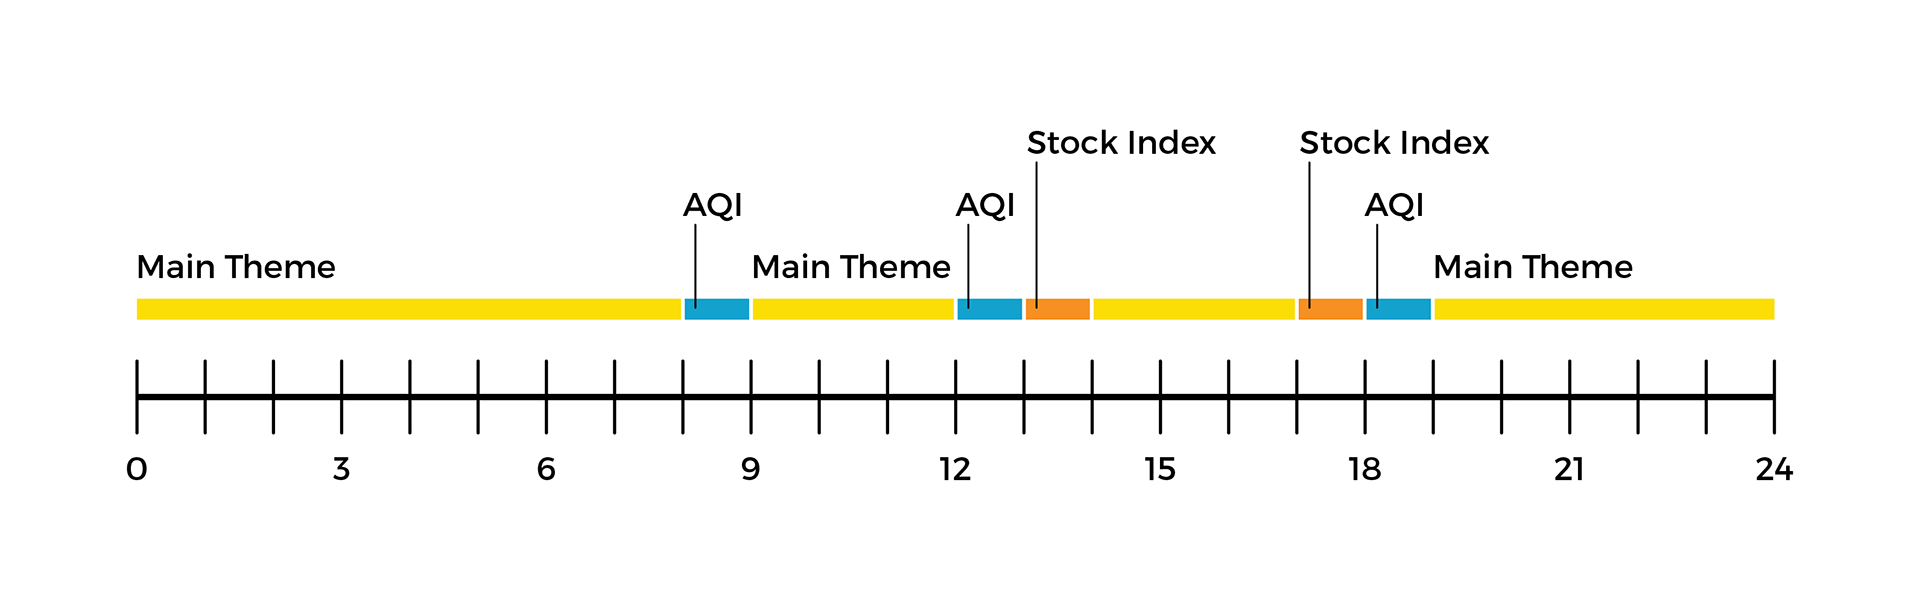
All these aspects considered, we came up with a ‘theme and trigger’ system, using a timeline to select which content to be displayed. Every screen displays the same theme in a specific period of time. We developed 3 computer generated themes that match office workers’ interests during each period of the day.
The main theme
‘Capsule’ was designed to retain user attention with a captivating capsule system design that developed from trails of a moving circle, and inform basic information: date, time, and outdoor weather. At the same time, customized inspirational quotes, keywords, and related symbols are also displayed to plant good thoughts and spread positive energy to people working at or visiting the Mitrtown Office Tower.
The second theme
‘Vector Field’ illustrates the local Air Quality Index through an animated vector field that makes each screen look like a floating fabric. The theme is triggered 3 times a day: 8-9 A.M when most office workers arrive at their offices, 12-1 P.M. when they go outside for lunch, and 6-7 P.M. when they leave the office, in order to get them prepared for a bad air day or help them feel safe to breathe in the clean air. Colors matching with the US AQI scales are embraced as the background of the animated vector field to make users aware of the air quality level with just a single glance.
The third theme
‘Isometric Cube’ focuses on stock index, informationally and visually. Data from each market is visualized through kinetic cubes, a landscape of moving cubes, adding movements to the architecture. The cubes are manipulated to form into digits and graphs to inform stock index and growth of the market.
Technical challenges
As mentioned above, the project visualizes data on 5 different screens, each connected with a computer to generate graphics in real time. There is one dedicated server who collects data from various sources. It keeps the schedule and triggers all the frontends when the theme has to be changed. The server provides data to all the frontends which turn it into graphics through algorithms. The entire visualization is programmed and generated using Unreal Engine 4. The server is written in Python.
To achieve the design concept, we set up 3 different virtual spaces. Each space has its own environment, lighting and data visualization system. There are 5 3D-cameras located in the space, capturing real time scenes.
The main theme
The ‘Capsule’ theme turns data into fonts and 3d paths, then algorithmically generates spheres which leaves trails as they travel along the paths.
The second theme
Technically, the challenge of the ‘Vector Field’ theme is to create an animated vector field. A custom shader is made for this theme in order to turn solid cylindrical geometries into a fabric-like plane. This ‘fabric’ waves according to the local wind speed.
The third theme
We developed the kinetic cubes as a key for the ‘Isometric Cube’ theme. The realistic light and shadow of these cubes is rendered with realtime ray tracing. This information is passed to a custom shader which determines the pillar movements.
Thanks to the clients for taking the journey of developing ‘Mitrtown Data Sculpture’ with us. Lastly, one thing that we believe is that we can create a good impact on users’ life by using creative technology in a creative new way, and this will change their life since then.